Corporate Emissions Inventory

Our 2023 corporate inventory includes scope 1 and scope 2 emissions from natural gas and electricity use at our offices across Canada and vehicle emissions for our Brightspot-owned-and-operated vehicle. Our scope 3 emissions relate largely to air travel for client site visits or team gatherings.
This inventory was calculated using the operational control approach and global warming potentials from the 2013 IPCC Assessment Report.
2023 Corporate GHG Emissions

Main GHG Emission Sources

GHG Emissions by Scope

Key Metrics
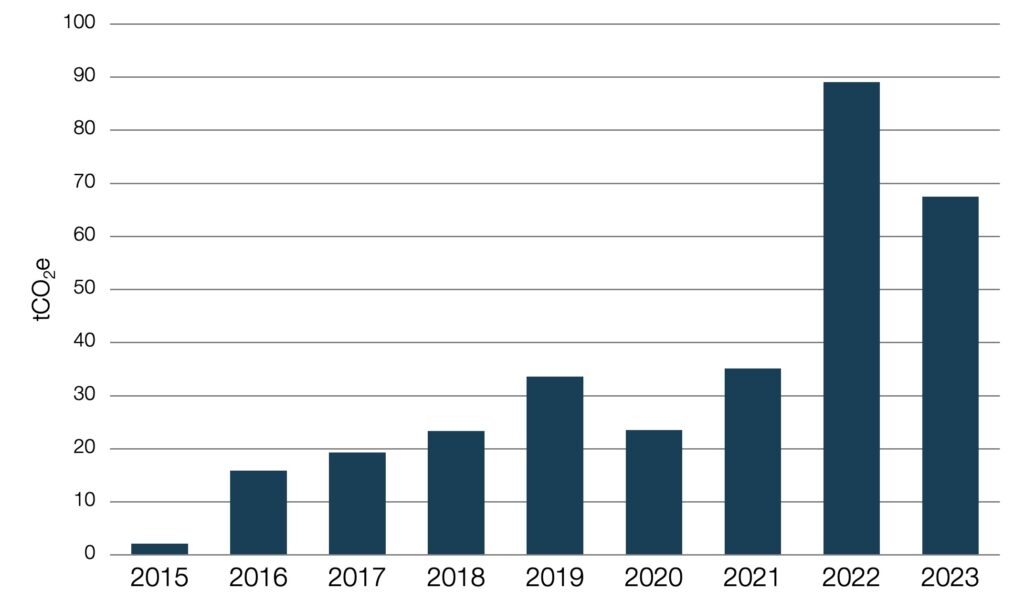
GHG Inventory Over Time

Brightspot’s absolute emissions have increased over time as the company has grown.
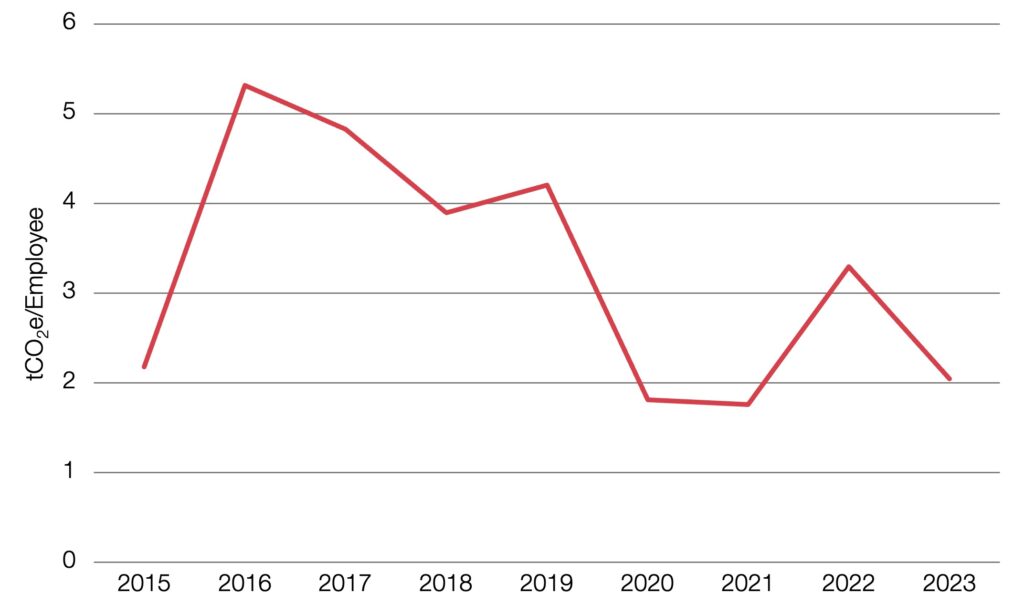
Emissions Intensity Over Time

Brightspot has chosen GHG emissions per employee as a reasonable metric for emissions intensity.
Our GHG emissions growth trajectory is largely attributed to our growth as a company, which is reflected in the number of employees. We saw a tangible decrease in emissions in 2020 due to the impact of the COVID-19 pandemic on travel, including travel for client site visits. Our emissions intensity increased in 2022 because all our employees traveled to Alberta for a corporate retreat. Our emissions decreased in 2023 partially due to a regulatory change such that less site travel is now required.

